The Professional MIS Expert Course
Build robust, scalable, Excel-automated MIS reports & dashboards.
Price returns to ₹1,999 once the first 100 founder enrollments are filled or July ends — whichever comes first.

Meet Your Mentor
Sobhish · Founder, SOBH's Analytics
19+ Yrs · IBM & Genpact Finance
"The same automation solutions I used to manage complex reporting and automation in my MNC finance career — now built into this program for you."
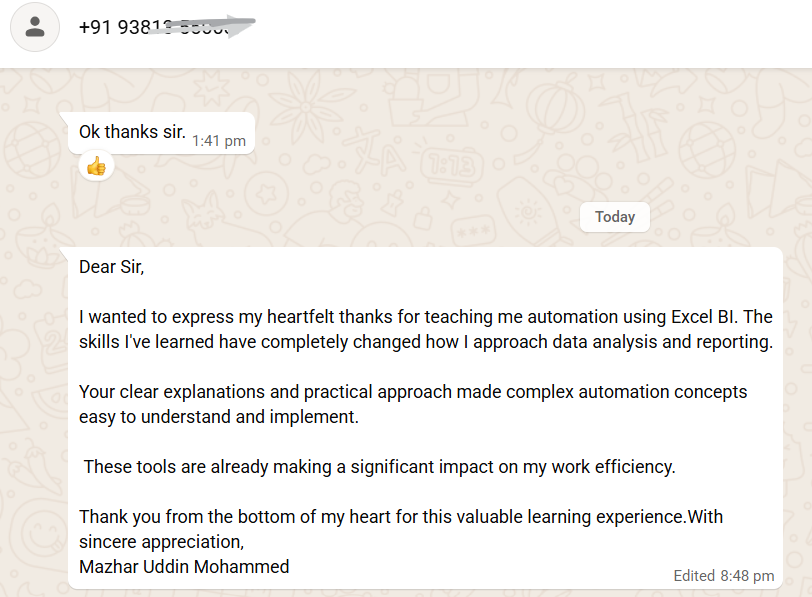
Don't just take my word for it — here's what one of our students says.
Now see how the program works for yourself, in under 6 minutes.
See It Before You Decide
In just 6 minutes, see the reports, projects and practical Excel skills you'll build — before you decide to enroll.
Now that you've seen how it works, let's make sure it's actually built for you.
Is This Program Right For You?
FP&A Professionals
Work with multiple datasets, want to automate reports like variance analysis.
MIS & Reporting Professionals
Want to focus on insights & analysis. Simplify & automate reports.
Finance & Accounting Professionals
Prepare for senior Excel-heavy analyst roles in Business Finance, FP&A.
Graduates & Freshers
Build job-ready projects that help you stand out in interviews.
Business & Data Analysts
Create insightful reports, automate analysis and solve business problems.
Excel-Heavy Roles
Automate repetitive work and manage large datasets with confidence.
If you saw yourself above, here's exactly what changes once you finish this program.
Same Excel. A Completely Different Career Outcome.
The difference isn't Excel itself — it's knowing how to automate reporting, analyze data and solve real business problems.
Routine Excel User
Spends most of the day preparing reports instead of analyzing them
Manual formulas like VLOOKUP and SUMIF keep breaking during month-end reporting
Large datasets and complex reporting reduce confidence
Resume doesn't demonstrate real reporting expertise
Professional Excel User
Automates reporting, builds scalable dashboards, and creates real projects that get noticed.
So what does that shift actually look like in your day-to-day work?
Top Analysts Don't Spend Hours Preparing Data.
They Spend Time Generating Insights.
Routine reporting will increasingly be automated. The future belongs to professionals who can automate data and provide insights for better decisions.
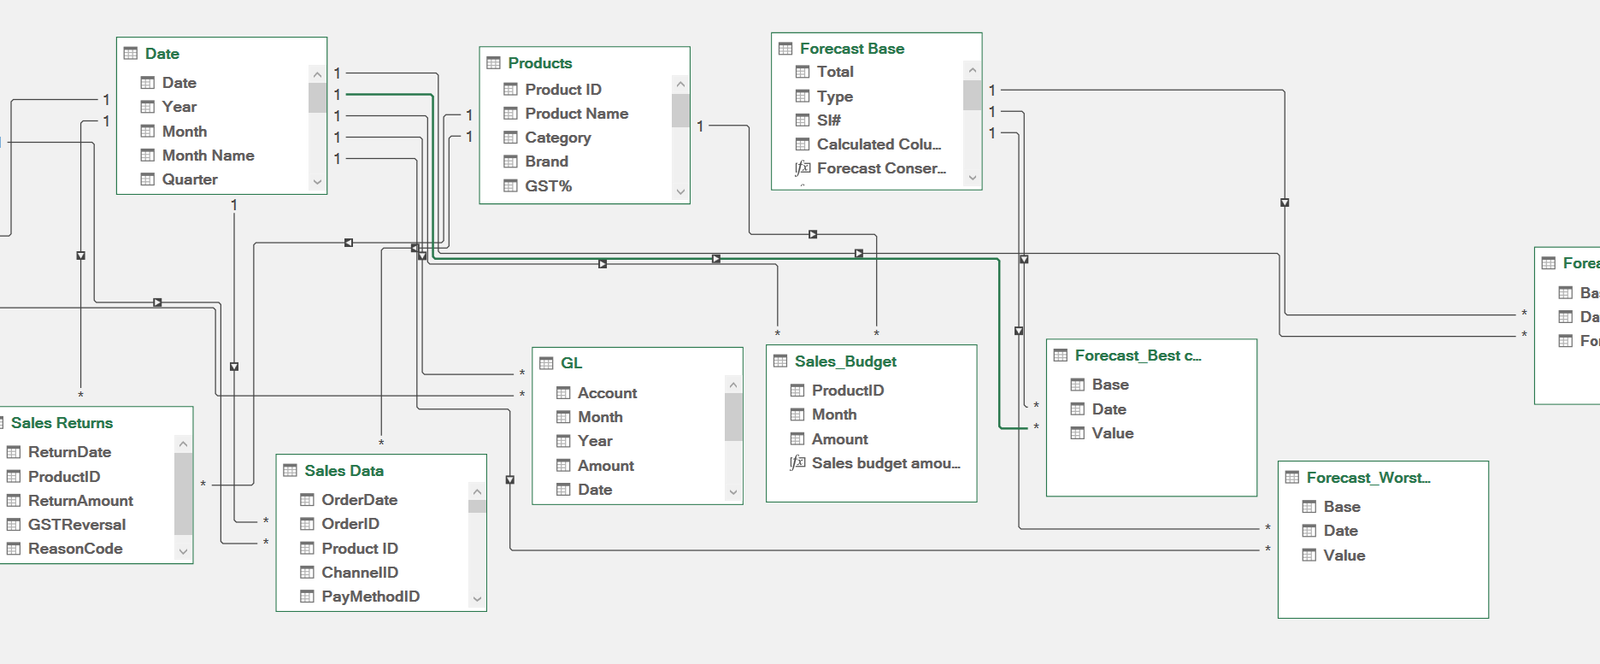
Here's the exact 5-level path that gets you there.
Your 5-Level Path To MIS Automation
Five structured levels, each with a real project — not just theory.
Excel Foundations
Beginner FriendlyFormatting, sort & filter, and data validation — the core Excel essentials every analyst needs.
Project Health Analysis
Hands-on ProjectsReal IT MNC contract data, 70+ Excel function problems, Pivot Tables, Project Plan vs Actual reporting, and a headcount dashboard.
Access Controlled Dashboard
No-Code AutomationClient requirements, access control, dynamic filters, TOPN functions, and logical thinking.
Finance Foundations
Decision SupportVertical analysis, horizontal analysis, trend analysis, Excel's Forecast tool, forecast scenarios, Goal Seek, Data Table and Solver.
Complex MIS & Dashboard Automation
Most PowerfulAutomated data extraction & cleaning, Power Query ETL, data modelling, basic to advanced DAX, automated variance & trend analysis, price-volume mix, P&L reporting, Opex deep-dive — a one-click refresh dashboard and the most comprehensive module.
Every level above is backed by a real project you'll build with real data — not just theory.
MNC Grade Real Dashboards
These are the exact reports and dashboards you'll build during the program.
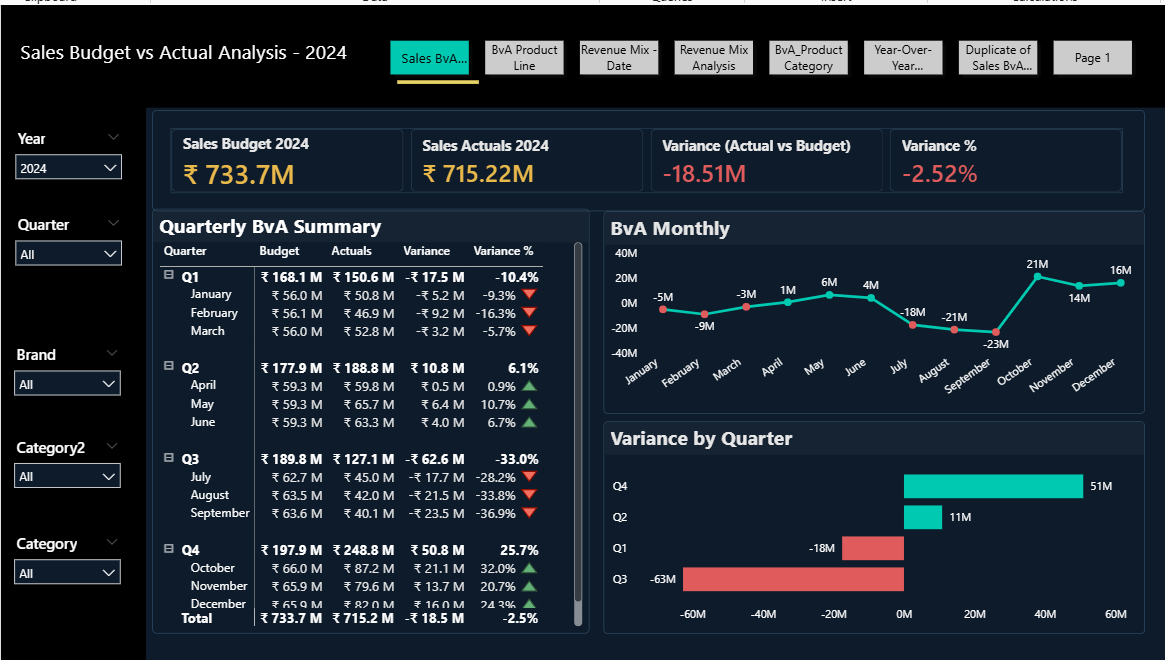
Budget vs Actual Variance
Power BIReady to start building these yourself? Here's how to get in.
Get Your Access Now Before The Price Changes
Self-Paced price returns to ₹1,999 once the first 100 founder enrollments are filled or July ends — whichever comes first.
Self-Paced
₹1,999
₹999
You save ₹1,500
✓MNC-Grade Excel Course
✓Designed For High-Value MIS Analyst Roles
✓5 Levels — Basics To MIS Automation
✓10+ Reporting Projects
✓3 Certifications
✓2 Valuable Bonuses (Limited Period)
✓Lifetime Access (If Enrolled Now)
✓Student Support To Clear Doubts
7-Day Refund Guarantee
Live With Sobhish
₹4,499
₹1,999
You save ₹2,000
✓Everything in Self-Paced
✓8-Day Live Dashboard Bootcamp
✓Live Mentoring By Sobhish
✓10th–25th Aug · Tue–Fri · 7–8 PM
✓Recordings + Live Q&A
✓Lifetime Access
Maximum 15–20 members for individual attention and Q&A.
Join The Live Cohort To Learn & Implement Automation On A Fast Track
Get access to all 5 levels plus 8 days of live sessions with Sobhish — for ₹1,999.
And enrolling today unlocks two more bonuses at no extra cost.
Two Bonus Courses, On Us


Total Bonus Value When You Enroll
Worth ₹5,497 · Today ₹999
(Live plan bundle worth ₹7,497 — today ₹1,999)
Don't just trust the offer — hear from people who've already gone through it.
Real People. Real Results.
1,500+ finance and accounting professionals trained across India.


"I used it at work the very next day"
The step-by-step approach to MIS automation using real MNC datasets is exactly what I was looking for. I was able to use these techniques in my job right away.
Sachin
Finance Professional · MNC
1,500+
Professionals Trained
Deloitte
Where Students Got Placed
IBM · EXL
And More MNCs
Every one of them also walks away with proof — three certifications you can add to your profile.
What You'll Walk Away With
Advanced Excel MIS Reporting & Dashboards
Excel Reporting & Automation
Power BI Essentials Data Visualization
Here's exactly what happens the moment you enroll.
What Happens After You Enroll
Enroll Now
Takes Less Than 60 SecondsReceive Your Access on WhatsApp
Within 30 MinutesStart Learning Today
Start ImmediatelyStill have questions? Here are the ones we hear most.
Common Questions, Honest Answers
Can a non-finance person join this program?
Definitely. You don't need a finance background. The program starts from Excel basics in Level 1 and builds up step by step — great for operations, HR, project management, or any role that works with data.
If you can use a computer and work with numbers in any way, you're ready.
What's the difference between the ₹999 and ₹1,999 plan?
Both give you the full 5-level program. The ₹1,999 plan adds 8 days of live sessions with Sobhish, where you build the dashboards together in real time.
Want live guidance and a project to show in 8 days? Go with ₹1,999. Prefer your own pace? ₹999 is a great start.
How long do I have access, and when do I get it?
Both plans include lifetime access, including future updates. Once you complete payment, you'll get your login link on WhatsApp within 30–60 minutes — you can start the same day.
What are the system requirements?
You need Microsoft Excel — most Windows computers already have it. All practice files are inside the course, nothing extra to buy. Some advanced automation tools in Level 5 need Windows; on a Mac you can still watch and learn, but hands-on practice needs a Windows computer.
Is this different from free YouTube Excel tutorials?
Very different. YouTube teaches functions in isolation. This program teaches how finance teams at MNCs actually work, using real data to build complete reports from scratch — from 19 years of Sobhish's own experience at IBM and Genpact.
Will this help me get a job in FP&A or Finance?
It will significantly improve your chances. Students who completed this program have moved into roles at Deloitte, EXL, IBM and other MNCs — because they graduate with real projects to show, not just a certificate.
What's next after I finish this course?
You can join the Advanced Financial Analytics Program (AFAP) — our next-level live program covering Power BI, AI for finance, and senior finance dashboards. Graduates of this course get priority access.
What's the refund policy?
A 7-day full refund, no questions asked. Email [email protected] within the first week.
WhatsApp Sobhish: +91 62825 57744 · [email protected]
If you want to see everything covered in detail, it's all below.
Full Curriculum, Level By Level
Open any level to see every topic covered.
Level 01
→ Excel Basics — Introduction
→ Excel User Interface
→ Entering Data into Excel
→ Raw Data Excel Introduction — Download this
Formatting in Excel→ Formatting Rows and Columns
→ Control & Shift Keys — Important Shortcut Keys
→ Text Formatting
→ Formatting Numbers
→ Formatting Dates
→ Formatting Others
Working with Data in Excel→ Filtering Data in Excel
→ Sorting Data
→ Find & Replace
→ Copy and Paste Data
→ Paste Special Function
→ Clean, Transform Group
→ Text to Column
→ Flash Fill
→ Remove Duplicates
→ Data Validation
→ Group and Subtotal Data
→ Consolidate Data
→ Insert Objects
Formula & Functions Introduction→ Functions & Formulas
→ Final Review & Others
Level 02
→ Course Introduction
→ Before you Start
→ Guidelines
→ Project Walk-through
→ Project Files
Text Functions Challenges→ 1. Join Text — Create a full name column
→ 2. Proper — Change Name to Proper
→ 3. Combine Functions
→ 4. Trim — Remove Extra Space
→ 5. Right Function — Extract Location ID
→ 6. Left Function — Extract Employee ID
→ 7. Dynamic Extraction Len & Left
→ 8. Flash Fill
Date Function Challenges→ 1. DATEDIF - DAYS — Calculate Average Days
→ 2. DATEDIF - MONTH — Calculate Months
→ 3. DATEDIF - YEAR — Employees Less than 1 year old
→ 4. Network Days — Calculate Total Working Days
→ 5. YEAR Function — Employees Joined in 2023
→ 6. MONTH — Employees joined in March '23
→ 7. Quarter — Employees Joined in Q1 '23
→ 8. TEXT — Any relieving dates on Sat or Sunday
→ 9. How many people relieved in 2022
→ 10. MONTH — Number of people relieved in Nov '22
→ 11. Quarter — Number of people relieved in Q1 '23
Number Function Challenges→ 1. Number Functions — Employee Working Days
→ 2. Number Functions — Labour Budget Summary
→ 3. Number Functions — Conveyance Actuals
Lookup Functions Challenges→ 1. Lookup Function Intro
→ Problem #1 — Which employee has the highest travel amount
→ Problem #3 — Reasons for Vlookup Errors & How to fix them
→ Problem #4 — Replace #NA Error with Text Value Not found
→ Problem #5 — What is the total Emp Count for Bangalore
→ Problem #6 — What is the employee count for Manager Jayan Tharakan
→ Problem #7 — How to use XLOOKUP to populate manager name
→ Problem #8 — Populate Experience Category
→ Problem #9 — Populate Employee Level
→ Problem #10 — Populate Weekday / Weekend based on Day
→ Problem #11 — How to use Xlookup with Wildcard
→ Problem #12 — How many people are under Leader Deepesh Jain
→ Problem #13 — What is the average Fresher Cost Rate
→ Problem #14 — How to avoid creating a Temporary Lookup column
→ Problem #15 — How to use Xlookup to populate Cost Rate
→ Problem #16 — How to use Xlookup with multiple criterias
→ Problem #17 — What is the Travel cost for Project PID002
→ Problem #18 — What is the total Labour Plan cost for PID003
→ Problem #19 — Calculate Monthly Labour Plan Cost
Logical Function Challenges→ Logical Functions Introduction
→ Problem #1 — Categorize Baselocation vs Others
→ Problem #2 — Category Travel as Approval Required and Not required
→ Problem #3 — Calculate 2H forecast scenario 1
→ Problem #4 — Populate Weekend vs Weekday in Travel
→ Problem #5 — Forecast Scenario 2
→ Problem #6 — Forecast Scenario 3
→ Problem #7 — What is the standard vs premium employee count
→ Problem #8 — 2H Forecast scenario 4
→ Problem #9 — How many Level 2 approval travel charges are there
→ Problem #10 — Forecast Scenario 5
→ Problem #11 — Categorize Conveyance Charges
→ Problem #12 — Create Experience Categories
→ Problem #13 — Forecast Scenario 6
Summarize Data — Pivot Tables→ Pivot Tables — Setting the Context
→ Problem #1 — Create a summary showing Employee Count by Location
→ Problem #2 — What is the Avg. Experience for each role
→ Problem #3 — What is the average experience by role & project
→ Problem #4 — Modify the Pivot table to change the design
→ Problem #5 — What is the count of employees under each leader
→ Problem #6 — Active vs In-Active employee count under each leader
→ Problem #7 — What is the premium vs standard employee count by project
→ Problem #8 — How many people joined in each year by month
→ Problem #9 — How many people were relieved each year by Quarter
→ Problem #10 — No. of people joined under each leader by year & Month
→ Problem #11 — Architect role with highest average cost rate
→ Problem #12 — Emp Count & Avg. cost rate for Tester & DBA Roles
→ Problem #13 — Percentage count of employees by location
→ Problem #14 — Percentage of conveyance spent in 2013
→ Problem #15 — Other expense total & percentage for 2023
→ Problem #16 — Other expense 2H '22 vs 1H '23 variance & percentage
→ Problem #17 — Plan labour variance & percentage variance
→ Problem #18 — Labour Actual variance & percentage variance
→ Budget vs Actual IT Project Financial Analysis
MIS Reporting→ MIS Reporting Introduction
→ MIS Reporting — Why to use Functions for MIS Reporting
→ Problem #1 — Create a summary showing location wise count
→ Problem #2 — Create a summary showing Premium vs Standard count
→ Problem #3 — Populate Employee count by Location & Status
→ Problem #4 — Populate Employee Count & Average Cost rate
→ Problem #5 — Calculate subtotal of employee cost rate
→ Problem #6 — FILTER & Average to calculate Grand total Average
→ Problem #7 — Travel Budget vs Actual Reporting Requirements
→ Problem #8 — Requirement analysis to report structure
→ Problem #9 — Populate the Travel budget & actual numbers
→ Problem #10 — How to install Power Query
→ Problem #11 — Designing & validation of Report
→ Problem #12 — Report 2 — Requirement Analysis
→ Problem #13 — Understanding KPIs & Calculations
→ Problem #14 — How to do your data study
→ Problem #15 — How do you structure your report
→ Problem #16 — Extract source data into calculation file
→ Problem #17 — Clean & Transform Budget Revenue
→ Problem #18 — Clean & Transform Revenue Actuals
→ Problem #19 — Clean & Transform Labour Plan Data
→ Problem #20 — Clean & Transform Labour Actual
→ Problem #21 — Clean & Transform Travel Plan
→ Problem #22 — Clean & Transform Travel Actuals
→ Problem #23 — Clean & Transform Other Expenses Plan
→ Problem #24 — Clean & Transform Other Exp Actuals
→ Problem #25 — Populating the numbers with SUMIFs
→ Problem #26 — Complete Remaining calculations
→ Problem #27 — Calculating QTD and YTD Numbers
→ Problem #28 — Enabling ALL FILTER for Project ID
→ Problem #29 — Formatting the Report
→ Problem #30 — Final Validation
Headcount Status Dashboard→ Dashboard Introduction
→ Two different approaches to Dashboard Building
→ Dashboard Creation Process
→ Dashboard Creation — Client Requirements
→ Problem #1 — Analyze Client requirements
→ Problem #2 — What is a wireframe and why to create it
→ Problem #3 — How to create Pivot Table summaries
→ Problem #4 — How & why to create a story board
→ Problem #5 — Create your Charts
→ Problem #6 — Which chart to choose when
→ Problem 7 — Format the chart elements
→ Problem 8 — Arrange Charts in Dashboard Layout
→ Problem 9 — Making the alignments right
→ Problem #10 — Create KPI Cards
→ Problem #11 — How to format your first chart
→ Problem #12 — How to use Templates
→ Problem #14 — Format KPI Visuals
→ Problem #15 — Create a Project Lead Slicer
→ Problem #16 — Final Changes
→ Course Wrap up
Level 03
→ Before you Start
→ Guidelines
→ Project Files
→ Project Files v.01
Excel Dynamic Dashboard→ 1. Requirement Analysis
→ 2. Study Data & KPI Calculations
→ 3. Prepare Employee Data
→ 4. Prepare Travel Data
→ 5. Create Calculation Sheet Part 1
→ 6. Calculation Sheet Employee Data Part 2
→ 7. Calculation Sheet Travel Part 1
→ 8. Calculate Forecast Figures
→ 9. Calculation Sheet Travel Continued
→ 10. Creating Charts
→ 11. Finalizing Headcount Dashboard
→ 12. Finalizing Travel Dashboard
→ 13. Finalizing Travel Dashboard Part B
→ 14. Setting up Access Control
→ 15. Setting up Access Control Part B
Level 04
→ 1. Dataset Introduction
→ 2. Prepare Calculation Sheet
→ 3. Creating a new Amount column
→ 4. Structuring Income Statement
→ 5. Formatting Income Statement
→ 6. Income Statement Vertical Analysis
→ 7. Formatting Vertical Analysis
→ 8. Income Statement Horizontal Analysis
→ 9. Vertical Analysis Conditional Formatting
→ 10. Trend Analysis
→ 11. Trend Analysis Formatting
→ 12. Operating Expense Budget vs Actual Analysis Part A
→ 13. Operating Expense Budget vs Actual — Formatting
Forecasting & Scenario Planning→ 14. Excel Forecasting Function Part A
→ Excel Forecasting Function Part B
→ Best case / Worst case / Base case Scenario Template
→ Forecasting Basecase Scenarios — Part 1
→ Forecasting Basecase Scenarios — Part B
→ Forecasting Basecase Scenarios — Part 3
→ Forecasting Basecase Scenarios — Part 4
→ Forecasting Basecase Scenarios — Part 5
→ Goal Seek
→ Data Table
→ Solver
→ Course Wrap up
Level 05
→ 1. Session Introduction
→ 2. How this learning is organized
→ 3. Excel BI Framework
→ Instructions (Important)
→ Project Data Files (Download)
→ Project Files
Get Data→ 4. Getting Data into Excel
→ 5. Extracting first data file into Excel
→ 6. Load Data & save
Power Query — Import & UI→ 7. Power Query UI Overview — 1
→ 8. Power Query UI Overview — 2
→ 9. Power Query UI Overview — 3
→ 10. Power Query UI Overview — 4
→ 11. Power Query UI Overview — 5
→ 12. Power Query UI Overview — 6
→ 13. Power Query Applied Steps
→ 14. Power Query Import Project Data
→ 15. Import Sales data from folder
Power Query — Transformation→ 16. Project Data Transformation — 1
→ 17. Project Data Transformation — 2
→ 18. Project Data Transformation — 3
→ 19. Project Data Transformation — 4
→ 20. Project Data Transformation — 5
→ 21. Project Data Transformation — 6
→ 22. Project Data Transformation — 7
→ 23. Project Data Transformation — 8
→ 24. Project Data Transformation — 9
→ 25. Project Data Transformation — 10
→ 26. Project Data Transformation — 11
→ 27. Data Transformation — Merge Queries
→ 28. Data Transformation — Group Data
→ 29. Data Transformation — Append
Data Modelling→ 30. Data Modelling Introduction
→ 31. Data Modelling — Fact & Dimension Tables
→ 32. Data Modelling — Primary & Foreign Keys
→ 33. Data Modelling — Connecting Tables
→ 34. DAX & Reporting — Introduction
DAX & Financial Reporting→ 35. DAX & Reporting — Creating a Measure
→ 36. DAX & Reporting — Aggregation Measures
→ 37. DAX & Reporting — Aggregation Functions Part B
→ 38. DAX & Reporting — Text, Date Functions
→ 39. DAX & Reporting — The Filter Context
→ 40. DAX & Reporting — GST Calculation with Iterative function
→ 41. DAX & Reporting — Iterative function measure
→ 42. DAX & Reporting — Forecast model with Iterative Function
→ 43. DAX & Reporting — Forecast best & base case scenarios
→ 44. DAX & Reporting — Creating a disconnected table
→ 45. DAX & Reporting — Dynamic Toggle Button
→ 46. DAX & Reporting — Handling Default State in measure
→ 47. DAX & Reporting — Using SWITCH for Scenarios
→ 48. DAX & Reporting — Dynamic Forecast with HASONEVALUE
→ 49. DAX & Reporting — Changing Filter Context with Calculate
→ 50. DAX & Reporting — Calculate with multiple filters
→ 51. DAX & Reporting — Sales Trend Analysis against Q4 '23
→ 52. DAX & Reporting — Sales Trend Analysis Avg Part B
→ 53. DAX & Reporting — Formatting Sales Trend Analysis
→ 54. DAX & Reporting — Opex Spend Analysis Part A
→ 55. DAX & Reporting — Opex Budget vs Actual Analysis — Part B
→ 56. DAX & Reporting — Opex Variance Analysis Part C
→ 57. DAX & Reporting — P&L Reporting Automation — Part A
→ 58. DAX & Reporting — CoA, P&L KPIs, Opening Stock
→ 59. DAX & Reporting — EBITDA, Net Margin Calculation
→ 60. DAX & Reporting — Formatting P&L Report
→ 61. DAX & Reporting — Analyzing Revenue Drop — PVM Analysis
→ 62. DAX & Reporting — Price Volume Impact Analysis — Part B
→ 63. DAX & Reporting — Formatting PVM Analysis
→ 64. DAX & Reporting — Analyzing EBITDA Drop
→ 65. DAX & Reporting — Opex BvM Analysis
→ 66. DAX & Reporting — Opex Spend Ratio Analysis
→ 67. DAX & Reporting — Opex Category Ratio Analysis
→ 68. DAX & Reporting — Opex to Revenue Analysis
→ 69. DAX & Reporting — Opex Monthly Budget vs Actual %
→ 70. DAX & Reporting — Opex Spend Deep dive
→ 71. DAX & Reporting — Formatting Opex Analysis
→ 72. DAX & Reporting — Change number formats
→ 73. DAX & Reporting — Opex Reporting Formatting Continued
→ 74. DAX & Reporting — Revenue Mix Analysis
→ 75. DAX & Reporting — Revenue Mix Analysis Formatting
→ 76. DAX & Reporting — Revenue Mix Percentage performance
→ 77. DAX & Reporting — Addressing Challenges with ALL Filter
→ 78. DAX & Reporting — Analyzing Product Sales Drop
→ 79. DAX & Reporting — Analyzing YTD Budget vs Actual
→ 80. DAX & Reporting — Year over Year Analysis